Dashboard
Turning fragmented data into actionable insight
Dealers on Motorway need to make decisions quickly across bidding, purchasing and post-sale operations. But the information they need to understand their performance was spread across different tools and reports, making it difficult to see what was working, identify risks and know where to focus next.
The Dealer Performance Dashboard brought key metrics and trends into a single experience within Motorway Pro. It gave dealers a clearer view of their bidding performance, spending and cancellations, creating the foundation for a more useful, data-led way to manage their business on the platform.
- Role
- Design Lead
- Product
- Motorway Dealer Dashboard
- Platform
- Web desktop & mobile
- Focus
- Strategy, design & data
The problem
Dealers had the data, but not the clarity.
Motorway generated a significant amount of data about dealer activity, but that information wasn't always easy to access or interpret. Dealers had limited visibility into how well they were performing, how their results changed over time and where they could improve.
This made it harder to make informed decisions about bidding, purchasing and managing their operations.
The challenge affected both dealers and Motorway:
- Dealers needed a clearer understanding of their performance, costs, win rates and cancellations.
- Dealer teams needed information they could use to make better decisions, rather than relying on fragmented reports or support.
- Motorway needed a more systematic way to influence dealer behaviour and improve the seller experience through better visibility and accountability.
The opportunity was to turn existing data into something genuinely useful: a central place where dealers could understand their performance and identify where to act.
The solution
One dashboard. A clearer picture of performance.
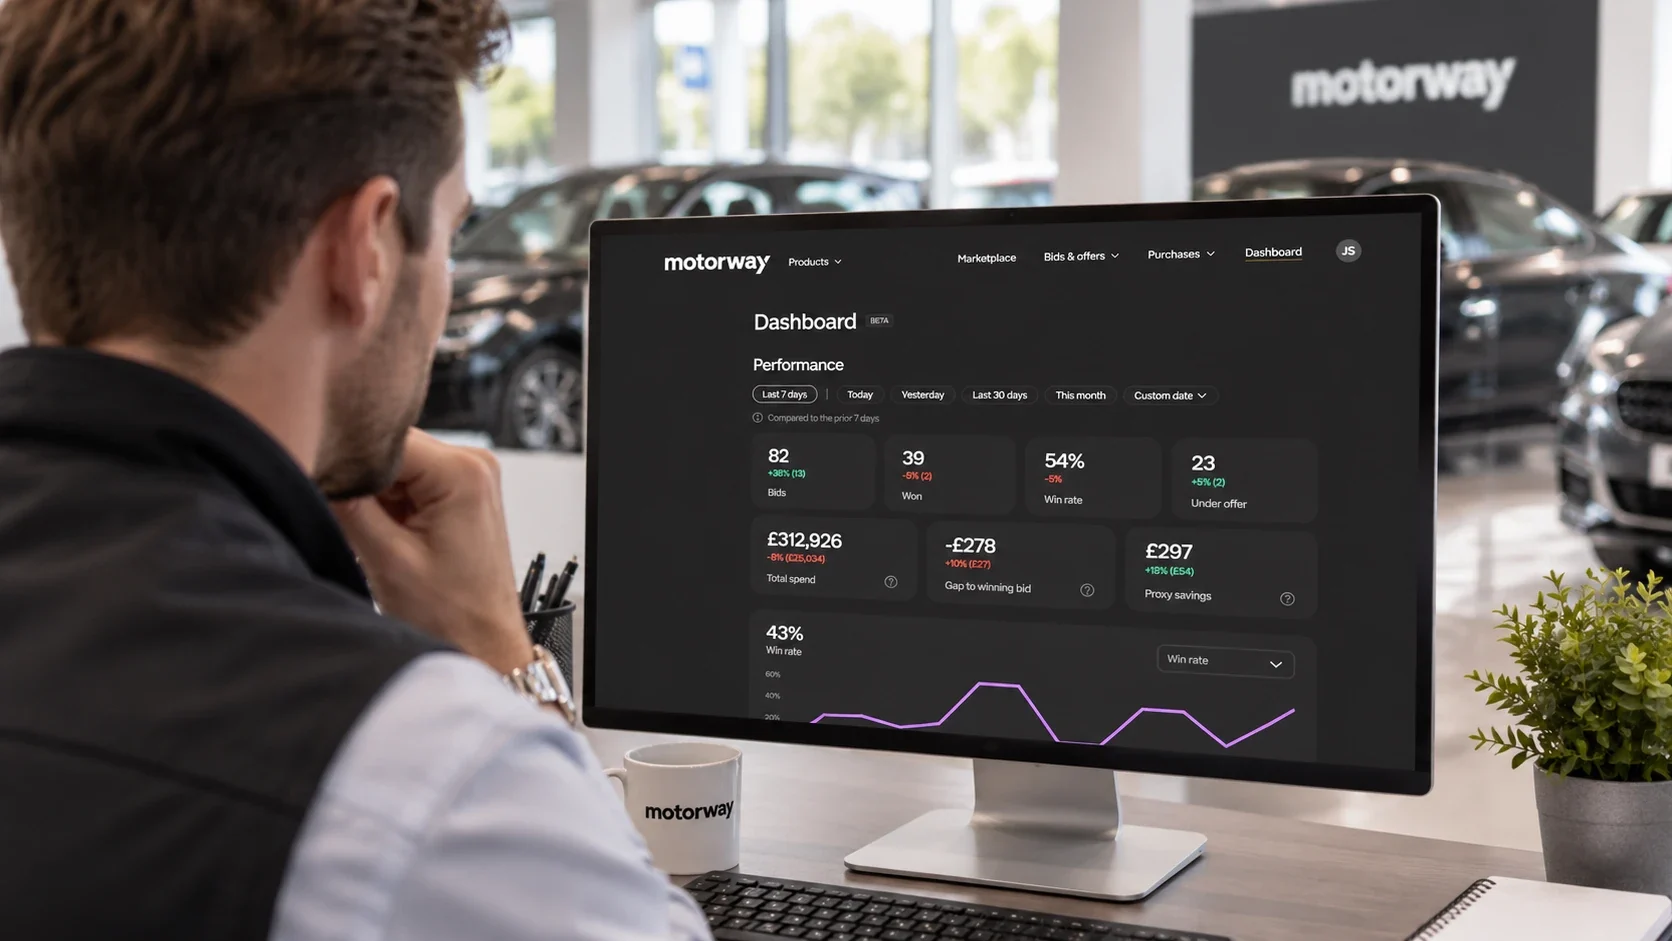
The Dealer Performance Dashboard brought key performance metrics, historical trends and cancellation information into a dedicated destination within Motorway Pro.
Rather than presenting data as a static report, the experience was designed to help dealers explore their performance across different time periods and understand the numbers behind their results.
The dashboard focused on three core areas:
Understand performance at a glance.
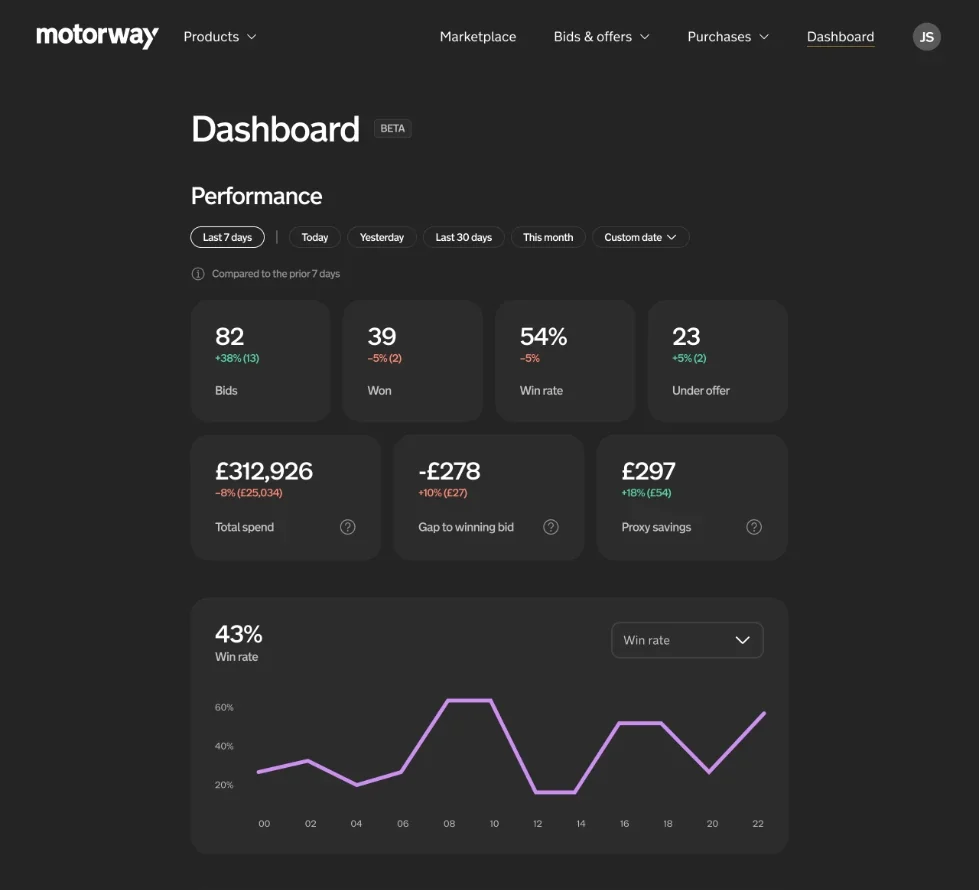
Bring key metrics such as bids, cars won, cars under offer and auction win rate together, allowing dealers to quickly assess how their business was performing.
Explore the numbers over time.
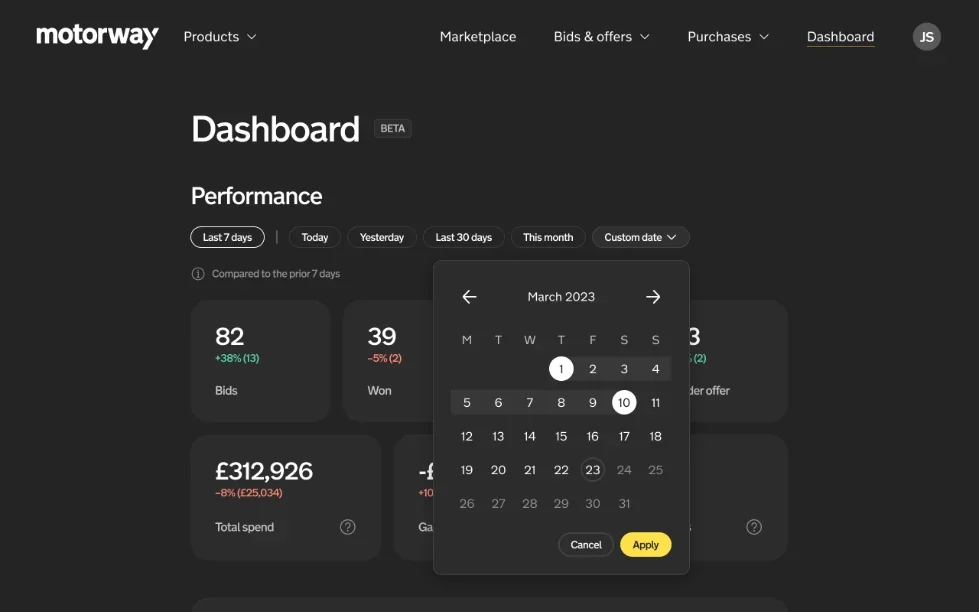
Provide date-range controls and trend charts so dealers could understand how their results changed and compare performance across different periods.
Identify operational risks.
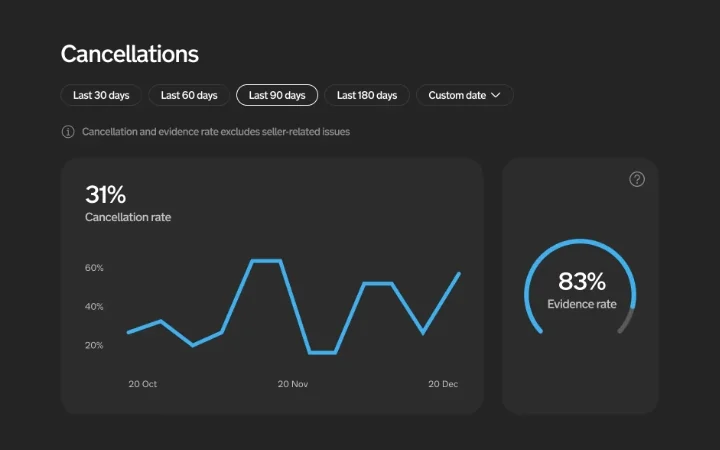
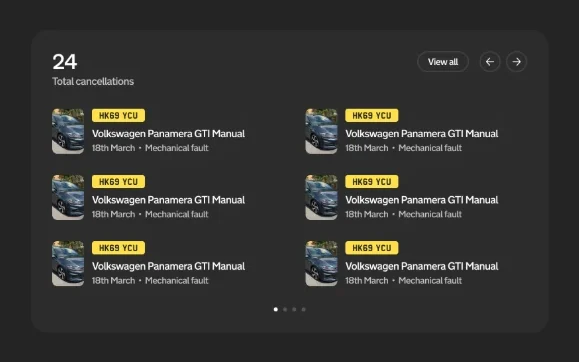
Give cancellations their own dedicated view, helping dealers monitor cancellation rates, review affected vehicles and understand the evidence associated with individual cases.
The result was a more structured way to explore dealer performance, with a foundation that could evolve as new insights and workflows were introduced.
The design & key decisions
Making complex performance data easier to understand.
01. Prioritise the metrics dealers need most
The dashboard brought headline figures into a clear hierarchy, separating key performance indicators from the more detailed trends beneath them.
Metrics included bids, cars won, cars under offer, auction win rate, bid acceptance rate, total spend, the gap to the winning bid and proxy savings.
This allowed dealers to scan their performance first, then explore the detail relevant to their business.
02. Make performance measurable over time
A single number provides limited context. Date-range filters and historical charts gave dealers a way to understand how their performance changed across different periods.
The V2 design expanded the available time-frame controls and refined the way metrics were presented, helping dealers move from simply seeing a result to understanding the trend behind it.
03. Give cancellations a dedicated experience
Cancellations needed a different treatment from general performance metrics because they represent a potential operational risk.
The dedicated cancellations view combined cancellation-rate trends with evidence-rate information and individual cancellation records. It also included contextual guidance when a dealer's cancellation rate approached a threshold.
This helped connect high-level performance data with the underlying cases dealers might need to investigate.
04. Design around real dealer needs
The dashboard wasn't designed in isolation. V2 was tested with four dealers, gathering feedback on the performance view, cancellations experience and a proposed bid target calculator.
The feedback helped distinguish what was useful from what needed further consideration. Dealers responded positively to the performance dashboard, while requesting additional time-frame options and refinements for high-volume users. The cancellations experience also tested positively.
The target calculator received a more mixed response, demonstrating the importance of validating whether a feature genuinely helps dealers rather than assuming that more information is always better.
Iteration & delivery
Building, testing and refining the experience.
The first dashboard iteration established the initial experience, while V2 introduced a more developed structure across performance, cancellations and the proposed calculator.
Testing provided an opportunity to refine the experience before expanding it further. Feedback highlighted the importance of flexible time periods, clearer presentation for high-volume dealers and making sure each section served a distinct purpose.
The work also exposed a less visible challenge: getting data ready for a customer-facing product was more complicated than expected.
Metrics needed to be clearly defined, aligned with other dealer-facing data sources and anchored to consistent dates. The team also had to work through dependencies on the Data team and the technical requirements of surfacing the information reliably.
This reinforced an important product principle: a dashboard is only as useful as the clarity and consistency of the data behind it.
The longer-term direction was to build on this foundation, evolving the dashboard from a reporting destination into a more proactive workspace that could surface priorities, highlight risks and guide dealers towards useful actions.
Outcomes & learnings
Establishing a foundation for better dealer decisions.
The dashboard progressed into a tested product experience, with V2 receiving positive feedback on its performance and cancellations views. The work established a foundation for bringing dealer metrics together and iterating on the experience using feedback and experimentation.
Key results and evidence
- 4 dealers — Participated in V2 design testing, covering the performance dashboard, cancellations dashboard and proposed target calculator.
- Positive feedback on two core views — The performance and cancellations dashboards tested well, with refinements identified for the next iteration.
- A clear direction for iteration — Dealer feedback helped prioritise improvements to the core dashboards while highlighting the need for a more cautious approach to the target calculator.
At the Q3 mid-point, weekly dashboard adoption was still below the team's target. The goal was for 30% of weekly bidding dealers to use the dashboard at least once per week by the end of the quarter. The team expected further iterations would be needed to move towards that goal.
This highlighted that delivering a useful dashboard was only part of the challenge. Dealers also needed a reason to return to it and a clear understanding of how it helped them run their business.
What I took away
This project reinforced that designing data-heavy products is as much about prioritisation and interpretation as it is about visual design.
A dashboard can contain all the right metrics and still fall short if users don't understand what the numbers mean, how they relate to their work or what to do with them.
Testing the experience with dealers helped identify where the design was already useful, where it needed refinement and where a proposed feature wasn't solving a clear enough problem.
The next opportunity was to move beyond reporting towards action: helping dealers understand not only how they were performing, but what deserved their attention next.